sanjana krishnan

Research | Coding | Consulting | Teaching
Data, Technology, Cities, Policy ++

About

Publications

Conferences, invited talks and panels

  • 2023: Paper presentation, "Technologies of the world's largest slum survey", AAG 2023, Denver
  • 2022: Guest lecture, “How is Mumbai using data and technology”, School of Management and Labour Studies, Tata Institute of Social Sciences, Mumbai
  • 2021: “Governing health futures: youth consultation on the principles of health data governance”, Wilton Park
  • 2020: Mechanism Design for Social Good (MD4SG), online DOI: 10.13140/RG.2.2.11192.37129
  • 2020: “COVID Risk Index for Pune city”, International Digital Health and AI Research (I-DAIR), virtual, Geneva
  • 2020: Changing Landscapes of Securities Market, Securities and Exchange Board of India, Mumbai
  • 2019: Data Governance Network Conference, National Law School of India University, Bangalore
  • 2019: ‘Mapping child safety’, Round Table meeting, Delhi Commission for Protection of Child Rights, Delhi
  • 2018: “Statistics for development policy”, Department of Statistics, St. Xavier’s College, Mumbai
  • 2017: 8th Annual International Conference on Climate Change, Tata Institute of Social Sciences, Mumbai

Portfolio

Some examples of my data, coding and web mapping projects

image shows map of land ownership in mumbai/></a>
                  <div class=

Land Ownership and Occupation in Mumbai

The map shows who owns the land that informal settlements are built on.

image shows Mumbai's local body election results map

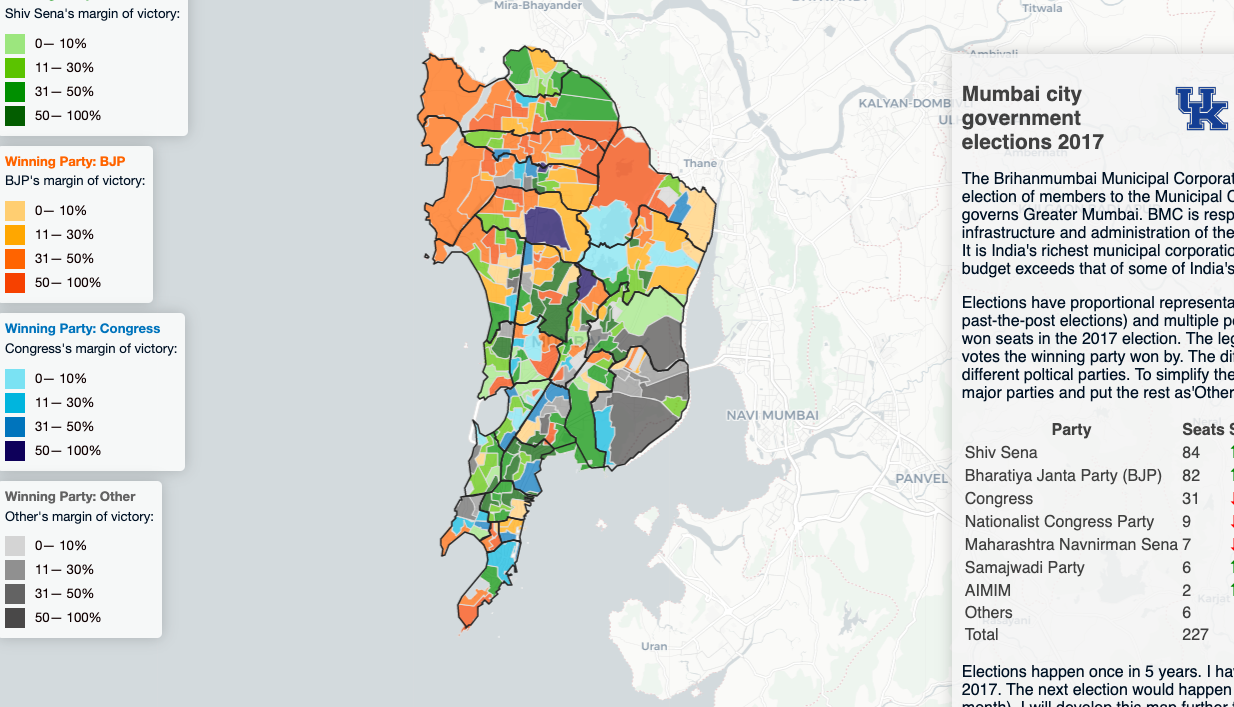
Mumbai Municipal Election results

Mumbai's 2017 city government election results visualized.

image shows dashboard used for tracking TISS COVID relief operations

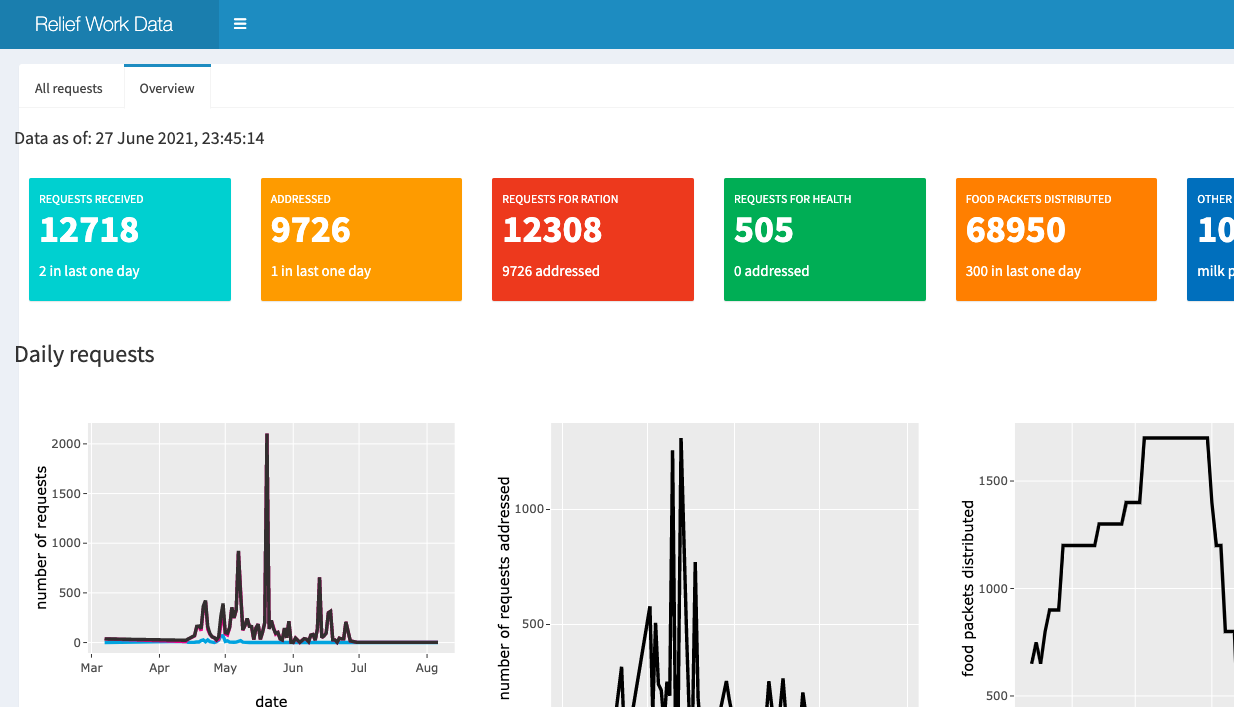
COVID relief work dashboard

Project for Tata Institute of Social Science's Community Led Action and Participation Project. The dashboard tracks covid relief effors undertaken during the second wave of COVID in Mumbai in Mar-Jun 2021.

image shows the visualization of vulnerability index produced from TISS CLAP 2020-21 survey

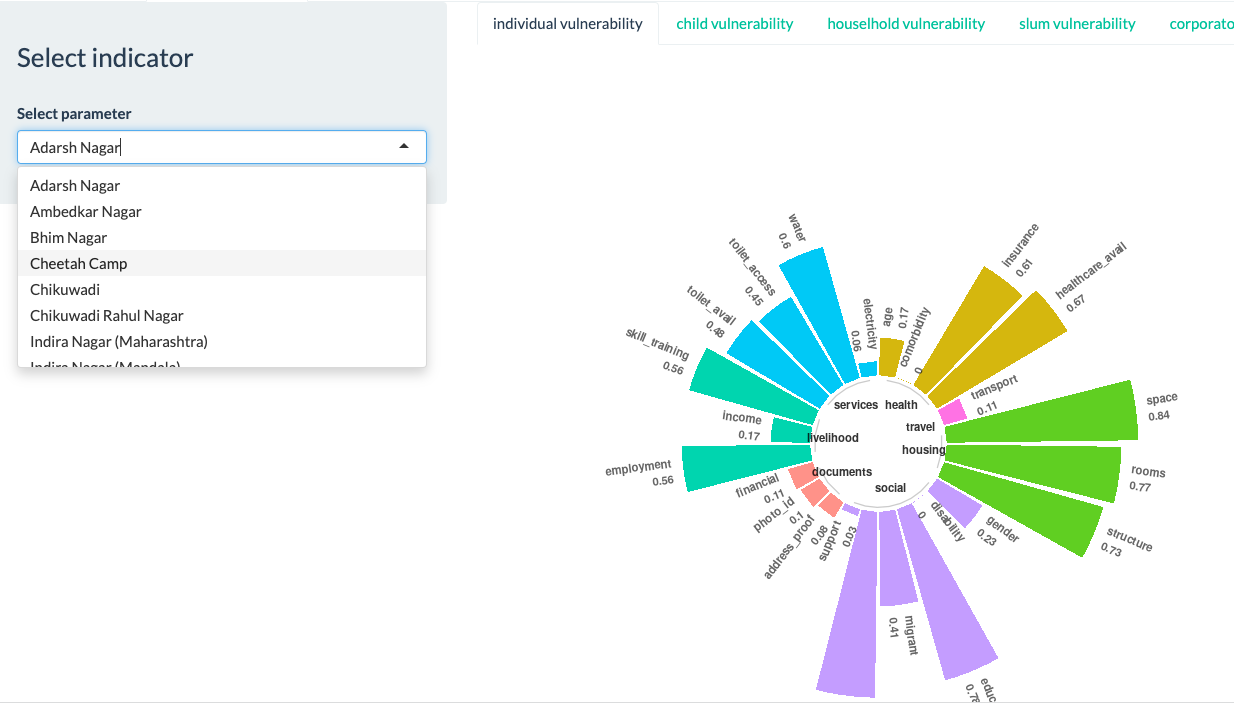
Vulnerability Index mapping

Project for Tata Institute of Social Science's Community Led Action and Participation Project. The project conducted a survey of 25,000 households in Mumbai's M-East Ward. The dashboard summarises results of the vulnerability index created to from the survey data.

image shows github repository containing datasets of mumbai's boundaries

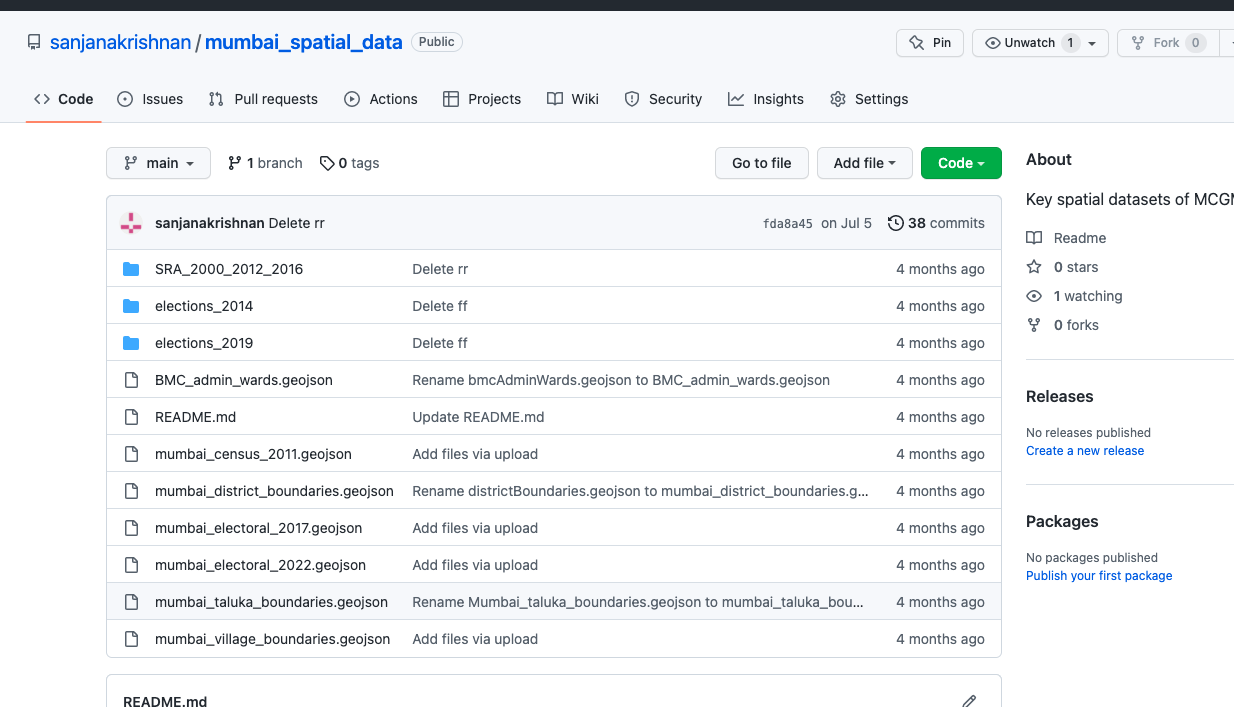
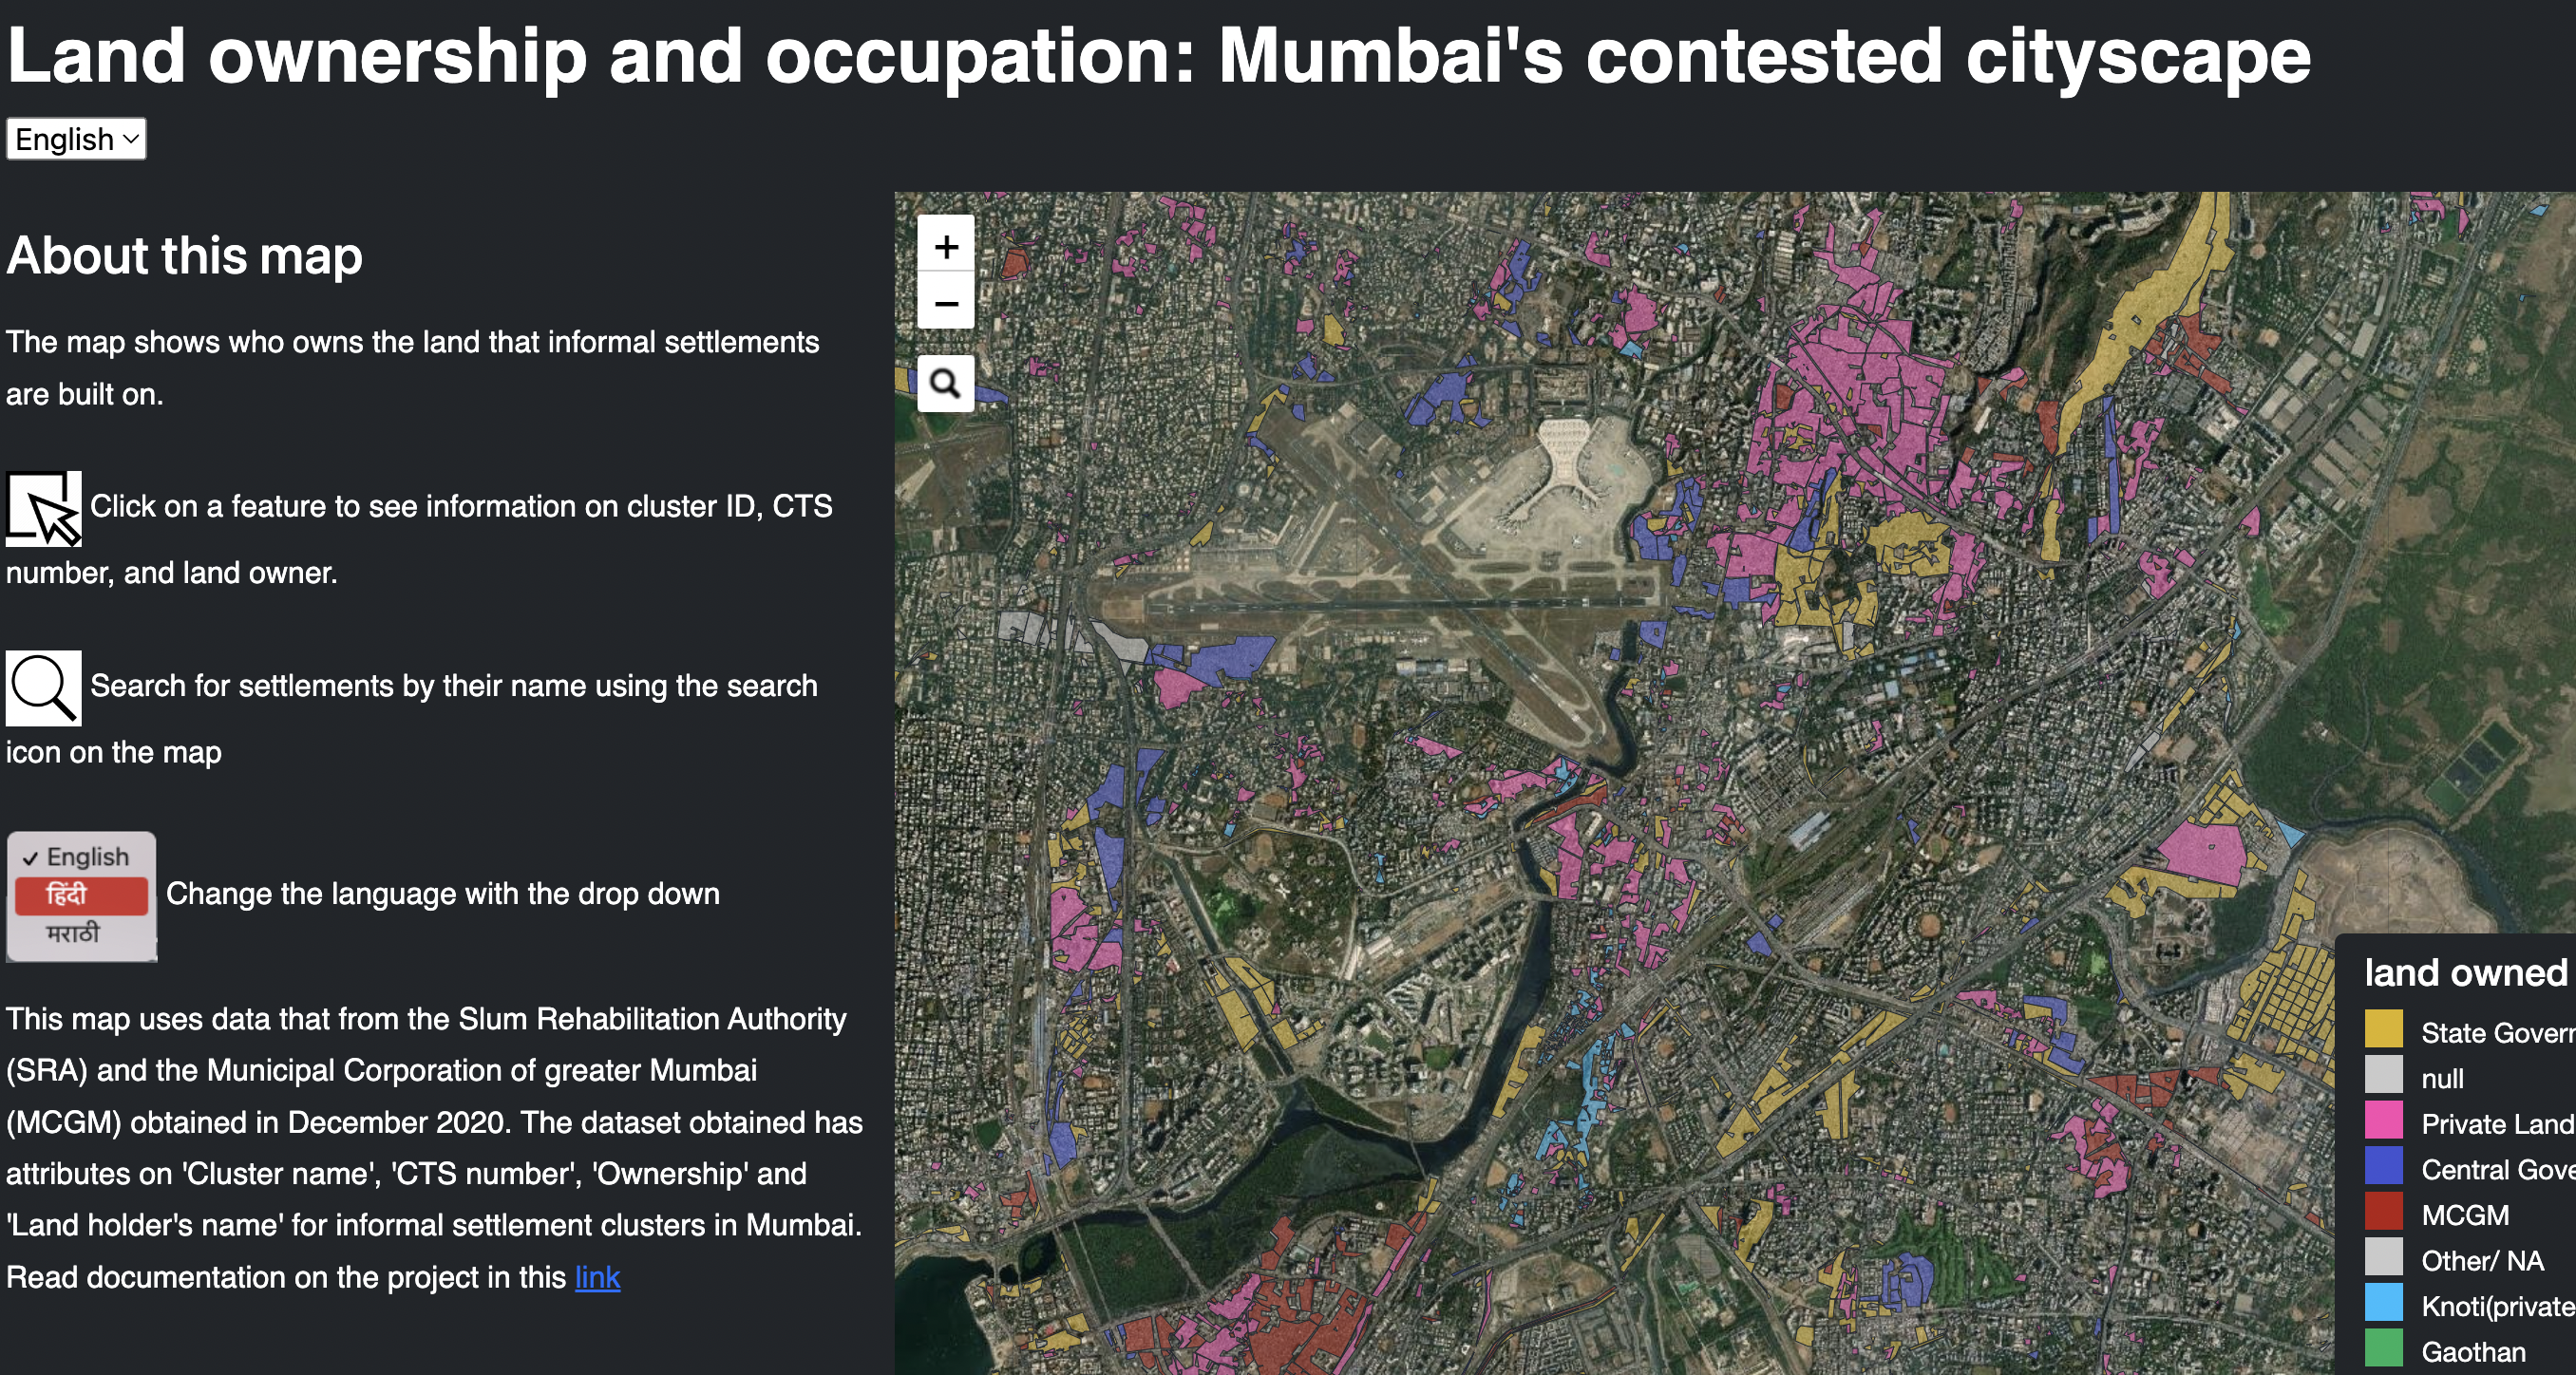
Repository of Mumbai's spatial datasets

Repository containing Mumbai's spatial boundary data on electoral wards (parliamentary, assembly and local body), administrative boundaries, census and basti (informal settlement) boundaries.

Contact

Hi, I am sanjana. I am currently a PhD candidate at the University of Kentucky. I have five years of experience in public policy, development, open data sector in strategic consulting, research and data analysis. Reach out to me at sanjana.krishn@gmail.com for projects and inquiries.

Technical skills

Coding
R
Python
JavaScript
GIS
QGIS for data analysis, manipulation, and, format conversion
PostGIS/SQL for data querying
Web Mapping
Leaflet for raster tilesets, basic thematic mapping, and telling stories with maps